From Peaks to Patterns
From Peaks to Patterns
Fathollahian, H., Salahshour, M.
- Location: Vienna, Austria
- Link: http://biovis.net/2025/biovisChallenges_vis/
- PDF: from-peaks-to-patterns_vis2025redesign.pdf
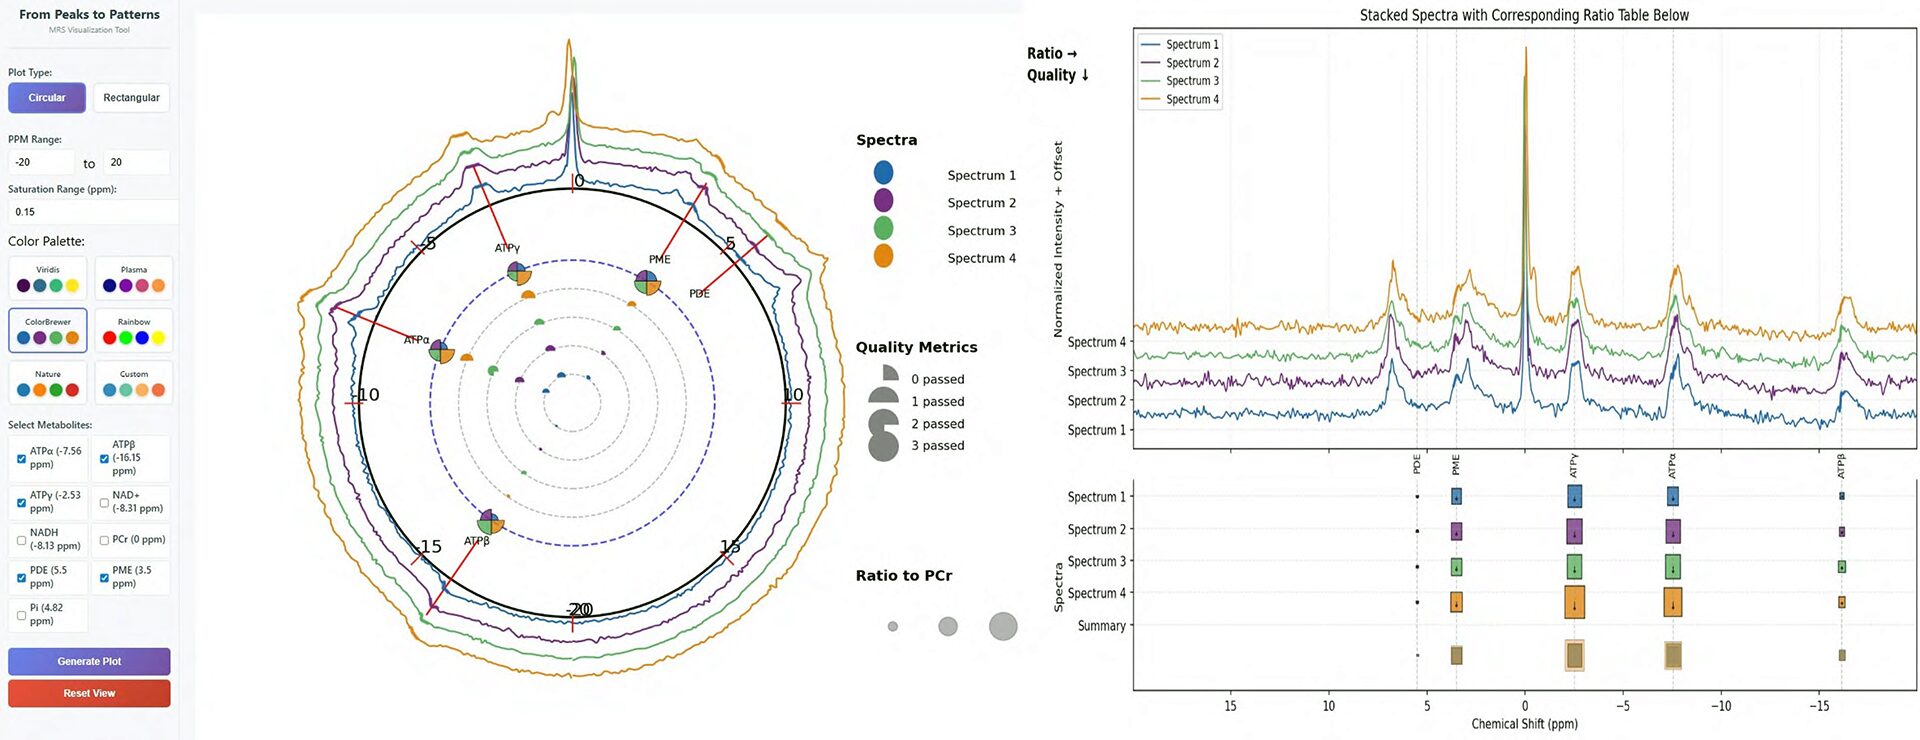
- Caption: Dual MRS Visualization Interface. (A) Metabolite selection panel; (B) Circular plot showing ratio (radius) and quality (saturation) with summary slices; (C) Rectangular plot displaying ratio (width), quality (height), and summary heatmap.
MRS is a non-invasive way of gaining information about cellular metabolism and can be used to study neurological and metabolic disorders. However, the clinical utility is limited by low signal quality, overlapping spectral peaks, and the inability to interpret and compare metabolite data. We developed an interactive visual analysis system that integrates methods for filtering, quality measurement, and comparative summaries of MRS signals, enabling researchers to more effectively evaluate and interpret spectral data. This will allow researchers to perform a more accurate evaluation of spectral data, which will help them understand the molecular processes behind the complex neurological and metabolic processes in greater depth.
Index Terms:</sstrong> Glyph-based Visualization, Quality Metrics, Multimodal Visualization.