Intrinsic Geometry Visualization for the Interactive Analysis of Brain Connectivity Patterns
Intrinsic Geometry Visualization for the Interactive Analysis of Brain Connectivity Patterns
Conte, G.,Ye, A.,Almryde, K.,Ajilore, O.,Leow, A.,Forbes, A. G.
- Location: San Francisco, CA
- PDF: conte_intrinsicbrainpatterns_vda2016.pdf
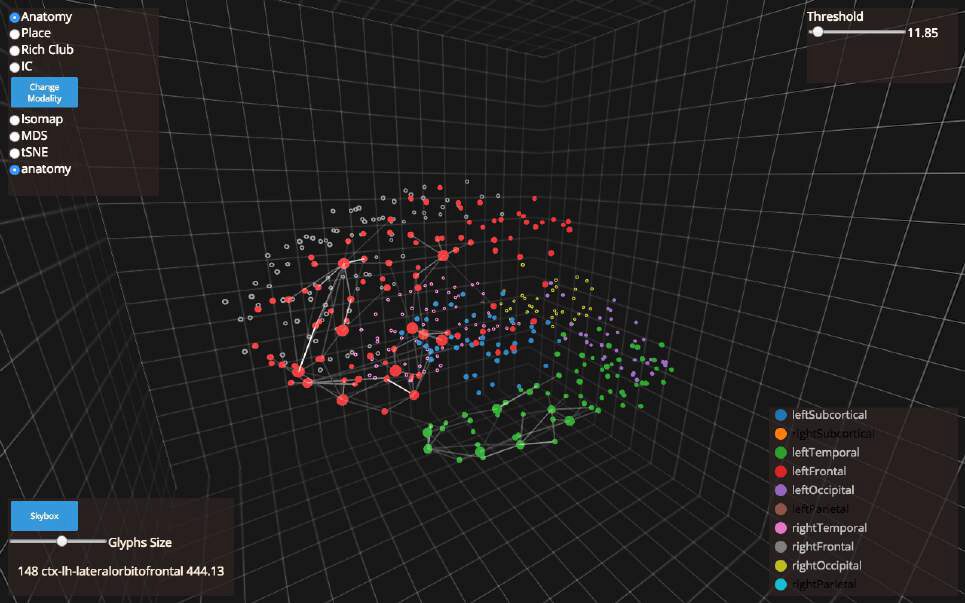
- Caption: This figure shows the main view of the web-based 3D visual analytics tool that allows user to interactively explore the intrinsic geometry of the connectome.
- Credit: G. Conte, EVL
Understanding how brain regions are interconnected is an important topic within the domain of neuroimaging. Advances in non-invasive technologies enable larger and more detailed images to be collected more quickly than ever before. These data contribute to create what is usually referred to as a connectome, that is, a comprehensive map of neural connections. The availability of connectome data allows for more interesting questions to be asked and more complex analyses to be conducted. In this paper we present a novel web-based 3D visual analytics tool that allows user to interactively explore the intrinsic geometry of the connectome. That is, brain data that has been transformed through a dimensionality reduction step, such as multidimensional scaling (MDS), Isomap, or t-distributed stochastic neighbor embedding (t-SNE) techniques. We evaluate our tool through a series of real-world case studies, demonstrating its effectiveness in aiding domain experts for a range of neuroimaging tasks.
Citation: Conte, G., Ye, A., Almryde, K., Ajilore, O., Leow, A., Forbes, A. G., Intrinsic Geometry Visualization for the Interactive Analysis of Brain Connectivity Patterns, Visualization and Data Analysis (VDA), Proceedings of IS&T Electronic Imaging, San Francisco, CA, 2016-02-16.