WiggleView : Visualizing Large Seismic Datasets
WiggleView : Visualizing Large Seismic Datasets
Nayak, A., Leigh, J., Johnson, A., Russo, R., Morin, P., Laughbon, C., Ahern T.
- Location: San Francisco, California
- URL: www.agu.org
- PDF: wiggleviewagu2002.pdf
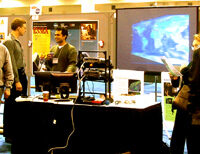
- Caption: Nayak Presents Wiggleview at AGU’s Fall Meeting
- Credit: A.Nayak, EVL
Wiggleview is a tool for visualizing seismic data collected from a worldwide network of seismometers. The visualization consists of overlaying familiar 2D seismic traces recorded for the N-S, E-W and vertical components of the earth’s displacement over the topographic map of the affected area. In addition, a 3D particle trace consisting of the integration of these 3 components provides a depiction of how an object placed at a particular seismic recording station would shake at the instant of the event. Data for the seismic events is obtained from repositories maintained by IRIS (Incorporated Research Institutions for Seismology) at the Data Management Center, Seattle Washington.